
news +insights
Builder Confidence Falls to 25 in November, Lowest Since April 2012
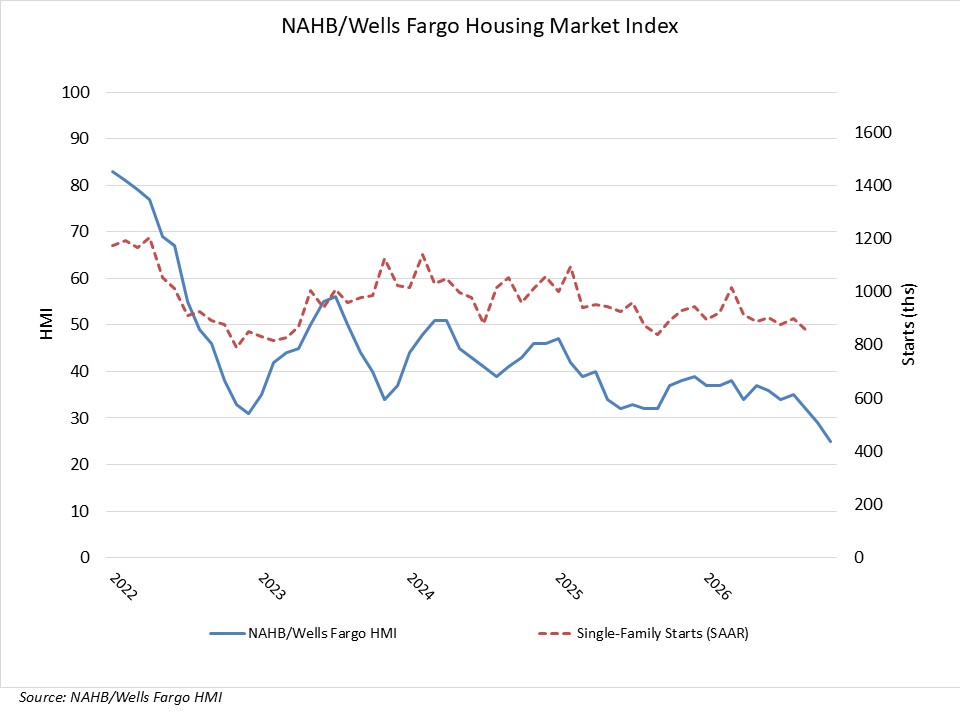
Builder confidence fell four points to 25 in November, the lowest reading since April 2012, according to the National Association of Home Builders/Wells Fargo Housing Market Index released Tuesday morning, November 17 (NAHB). Builders cited mortgage rates above 7%, tariff-driven material costs, rising subcontractor rates and labor shortages tied to immigration enforcement, and 46% of them cut prices during the month.
What Happened
The index measures how single-family builders rate current sales, sales expectations for the next six months and traffic of prospective buyers. Any reading below 50 means more builders view conditions as poor than good (NAHB). November's 25 follows a reading of 29 in October, which we reported last month as the lowest since 2012 at the time.
The drop was larger than forecasters expected. Economists polled by Reuters had projected the index would hold at 29 (Reuters via Investing.com). HousingWire described the reading as the weakest builder confidence since the late stages of the global financial crisis (HousingWire).
NAHB Chairman Bill Owens, a home builder and remodeler from Worthington, Ohio, said builders face multiple challenges at once. He said stepped-up immigration enforcement is keeping legal workers off job sites and raising costs, and that higher fuel prices are prompting subcontractors to raise their rates sharply (NAHB). NAHB Chief Economist Robert Dietz pointed to building material costs pushed higher by tariffs, an ongoing shortage of construction workers and regulation on the supply side, and to mortgage rates above 7%, softer consumer confidence and an uncertain outlook on the demand side (NAHB). NAHB's economics team added that single-family builders are pulling back on construction volumes as a result (Eye on Housing).
What Is Confirmed
- All three components fell. Current sales conditions dropped six points to 28, sales expectations for the next six months fell two points to 30, and prospective buyer traffic fell two points to 16, its lowest level in 15 years outside the start of the pandemic in 2020 (NAHB).
- Price cuts hit a post-Covid high. 46% of builders reduced prices in November. The average reduction held at 6% for an eighth straight month (NAHB).
- Incentives are near universal. 68% of builders offered sales incentives, also a post-Covid high and the 20th consecutive month at 60% or more (NAHB).
- Every region declined. On a three-month moving average, the Northeast fell four points to 34, the Midwest fell five points to 35, the South fell three points to 27 and the West fell three points to 23 (Eye on Housing).
Rates, Sales and Margins
Financing remains the main drag on demand. The 30-year fixed mortgage rate has risen 120 basis points since February, peaked at an average of 7.40% in mid-October, a three-year high, and has since eased to 7.18%, according to Freddie Mac data cited by Reuters. Reuters also noted that sales of previously owned homes fell to their lowest level in more than 16 years in October, and that homebuilding is being held back by an overhang of unsold new homes and higher material prices from import tariffs.
Public builders are trading margin for sales. HousingWire reported that the median new-home sales price in September was about $400,000, down nearly 4% from a year earlier, and that third-quarter gross margins fell at several large builders, including Lennar at 15.8%, down from 17.5%, and PulteGroup at 24.8%, down from 26.2% (HousingWire). PulteGroup reported that traffic to its communities fell 14% from a year earlier in the third quarter (HousingWire).
What It Means for Owners and Contractors
The index tracks single-family homebuilders, not commercial or industrial work, but several of the pressures it describes reach every jobsite. Owens' comment that subcontractors are raising rates sharply because of fuel costs matches what commercial contractors have seen in input prices, which rose 11.2% from a year earlier in September, as covered in our report on ABC's input price data. Tariffs on materials and immigration enforcement affecting labor availability apply to commercial projects as well as homes.
For general contractors and subcontractors, a pullback in single-family volume can free up some residential crews, particularly framing, drywall, roofing and site trades. Federal data already show that shift beginning: residential specialty trade contractors shed 15,200 jobs in October while nonresidential contractors added workers, as reported in our October jobs report coverage. Contractors bidding commercial and light industrial work may see more residential subcontractors pursuing those jobs, though that does not offset the wider labor shortage documented in recent quits and job openings data.
For owners and developers, mortgage rates above 7% signal a financing environment that also affects construction loans on multifamily and mixed-use projects. Sponsors relying on for-sale absorption should test pricing and pace assumptions against a market where nearly half of builders are cutting prices. Material suppliers that serve both housing and commercial customers may adjust allocation and lead times as residential volume slows.
What to Watch
- The Census Bureau's next new residential construction report, which will show whether weaker sentiment is turning into fewer starts after September's drop to a 1.221 million annual pace, covered in our September housing starts report.
- Weekly Freddie Mac mortgage rate data, and whether rates continue to ease from the 7.40% October peak (Reuters via Investing.com).
- The share of builders cutting prices and using incentives in December's index, after both reached post-Covid highs in November (NAHB).
- Fourth-quarter builder margins, as Century Communities has said it expects incentives on closed homes to rise 200 to 250 basis points from third-quarter levels (HousingWire).
Key Questions
What is the NAHB builder confidence index for November 2026?
The NAHB/Wells Fargo Housing Market Index fell four points to 25 in November 2026, the lowest reading since April 2012, according to the release issued November 17, 2026 (NAHB).
How many builders cut prices in November 2026?
NAHB reported that 46% of builders cut prices in November 2026, the highest share in the post-Covid period, with an average reduction of 6%, and 68% used sales incentives (NAHB).
Why did builder confidence fall in November 2026?
NAHB cited mortgage rates above 7%, tariff-driven building material costs, labor shortages tied to immigration enforcement and higher fuel prices that are pushing subcontractor rates up (NAHB).
Which region has the lowest builder confidence?
The West had the lowest three-month average reading at 23 in November 2026, followed by the South at 27, the Northeast at 34 and the Midwest at 35 (Eye on Housing).
Related Coverage
- Builder Confidence Falls to 29 in October, Lowest Since 2012
- September Housing Starts Fall 5.2% to 1.221 Million Annual Rate
- October Jobs Report 2026: Construction Sheds 3,000 Jobs as Payrolls Rise 165,000
- Update: Construction Input Prices Up 11.2% in September, Most in Nearly 4 Years
Image credit: National Association of Home Builders (Eye on Housing). Image from the source article.
Sources
- NAHB, “Builder Sentiment Continues to Fall on Affordability Concerns,” https://www.nahb.org/news-and-economics/press-releases/2026/11/builder-sentiment-continues-to-fall-on-affordability-concerns
- Eye on Housing (NAHB), “Builder Sentiment Continues to Fall on Affordability Concerns,” https://eyeonhousing.org/2026/11/builder-sentiment-continues-to-fall-on-affordability-concerns/
- Reuters via Investing.com, “US homebuilder sentiment tumbles to more than 14-1/2-year low in November,” https://www.investing.com/news/economic-indicators/us-homebuilder-sentiment-tumbles-to-more-than-1412year-low-in-november-5033422
- HousingWire, “Homebuilder confidence sinks to a 14-year low as buyers hibernate,” https://www.housingwire.com/articles/homebuilder-confidence-november-2026/


Let's connect
For organizations planning commercial, industrial, or infrastructure work, we will review the project and recommend the appropriate delivery approach.

Join our team
If you hold yourself to careful, accountable work, you already work the way we do.