
news +insights
Q3 2026 GDP Growth Hits 3.4% as Investment Leads and Inflation Cools

Q3 2026 GDP growth came in at a 3.4% annual rate, up from 2.2% in the second quarter, according to the advance estimate the U.S. Bureau of Economic Analysis released at 8:30 a.m. Eastern on Thursday, October 29. The pickup was driven mainly by investment, led by equipment and inventories, while every major inflation gauge in the report slowed sharply from the spring (Bureau of Economic Analysis).
The report lands one day after the Federal Reserve held its benchmark rate steady in a split vote, with two policymakers preferring an increase (Federal Reserve). For owners, developers and contractors weighing financing and bid timing, the two releases together frame the cost of money heading into the final two months of 2026. This is a first estimate and will be revised.
What Happened
Real gross domestic product, the inflation adjusted value of goods and services produced in the United States, rose at a seasonally adjusted annual rate of 3.4% in the July through September quarter. That works out to about 0.8% at a quarterly rate. In the second quarter, growth was 2.2% (BEA).
BEA said the increase in the third quarter reflected gains in investment, consumer spending and government spending, partly offset by a decline in exports. Imports, which are subtracted in the GDP calculation, increased. The agency said the acceleration from the second quarter primarily reflected an acceleration in investment (BEA).
Current dollar GDP, which is not adjusted for inflation, grew at a 5.6% annual rate in the quarter (BEA).
What Is Confirmed
Investment
The increase in investment was led by equipment, mainly information processing equipment such as computers and peripheral equipment, and by private inventory investment. Inventory building was led by wholesale trade and manufacturing, in both cases led by nondurable goods (BEA).
The release summary does not give separate growth rates for nonresidential structures or residential investment, the two GDP lines that track most closely with building construction. Those figures are published in BEA’s detailed national accounts tables, and the summary text did not single out either category as a leading contributor or a drag (BEA).
Consumer and Government Spending
Consumer spending rose for both services and goods. BEA said health care and food services and accommodations led the services gain, while prescription drugs led the goods gain (BEA).
Government spending increased, and the gain was more than accounted for by federal spending, led by nondefense consumption. BEA said that reflected smaller sales of crude oil from the Strategic Petroleum Reserve than in the second quarter. Because those sales are subtracted from government consumption, lower sales raised measured spending (BEA).
Prices
Inflation measures in the report all slowed from the second quarter:
- The price index for gross domestic purchases rose 3.0%, down from 5.6%.
- The personal consumption expenditures (PCE) price index rose 2.1%, down from 5.0%.
- The PCE price index excluding food and energy rose 2.5%, down from 3.3%.
All figures are seasonally adjusted annual rates (BEA).
Underlying Demand
Real final sales to private domestic purchasers, the sum of consumer spending and private fixed investment, rose 4.9%, up from 4.6% in the second quarter (BEA). The measure strips out inventories, trade and government, and is often used as a read on private demand.
The Fed Backdrop
On Wednesday, October 28, the Federal Open Market Committee kept the federal funds target range at 3-3/4 to 4 percent. The vote was 10 to 2. Lisa D. Cook and Beth M. Hammack dissented, preferring to raise the range by a quarter percentage point (Federal Reserve).
The Committee’s statement said economic activity is “expanding at a strong pace,” that “domestic spending has been resilient” and that “capital investment is robust.” It said job gains have kept pace with the workforce and the unemployment rate has changed little, but that “inflation remains elevated.” The statement cited geopolitical developments as a source of uncertainty (Federal Reserve).
What It Means for Owners and Contractors
Two points in this report matter most for construction. First, the investment story in the third quarter was about equipment and inventories, not buildings. The release credits computers and related equipment and inventory building for the gain, and it does not name structures as a driver. That is consistent with recent construction data on this site showing a mixed picture: September construction starts dipped 1.5% with commercial starts down 18%, according to our coverage of the Dodge report, and architecture billings fell to 44.7 in September, according to our coverage of the AIA index.
Second, inflation slowed. PCE inflation at 2.1% for the quarter is close to the Fed’s 2 percent goal, and core PCE eased to 2.5% (BEA). But the Fed held rates one day earlier and two members wanted a hike (Federal Reserve). Owners and developers relying on construction loans or bond financing should not assume this report alone moves borrowing costs lower. Strong growth tends to argue against cuts, while cooler inflation argues for patience on hikes.
For contractors, rising consumer spending on health care and food services and inventory building in wholesale trade and manufacturing point to continued activity in the sectors those facilities serve. Firms with bids pending on healthcare, food and beverage, distribution and manufacturing work should watch whether this demand translates into released projects over the next two quarters.
What to Watch
- BEA’s detailed tables for the quarter, which will show the change in nonresidential structures and residential investment.
- The second estimate of third quarter GDP, scheduled for November 25, 2026, at 8:30 a.m. Eastern (BEA). Advance estimates are routinely revised as more source data arrive.
- Fed communication after the split October vote, and whether more members join the call for a rate increase.
- Upcoming construction spending, starts and employment data, which will show whether building activity is following the broader economy.
Key Questions
What was U.S. GDP growth in the third quarter of 2026?
Real GDP grew at a 3.4% annual rate in the third quarter of 2026, up from 2.2% in the second quarter, according to the Bureau of Economic Analysis advance estimate released October 29, 2026 (BEA).
What drove Q3 2026 GDP growth?
BEA said the acceleration primarily reflected investment, led by information processing equipment and private inventories, with consumer and government spending also rising and exports falling (BEA).
Did inflation slow in the Q3 2026 GDP report?
Yes. The PCE price index rose 2.1%, down from 5.0% in the second quarter, and core PCE rose 2.5%, down from 3.3% (BEA).
When is the next Q3 2026 GDP estimate?
BEA plans to release its second estimate of third quarter 2026 GDP on November 25, 2026, at 8:30 a.m. Eastern. Figures for structures investment are not given in the advance release summary (BEA).
Related Coverage
- September Construction Starts Dip 1.5% as Commercial Falls 18%
- Architecture Billings Fall to 44.7 in September as Design Contracts Drop
- New Home Sales Slip to 676,000 in September as Supply Holds at 8.4 Months
- Construction Jobs by State: 34 States Up Year Over Year in September
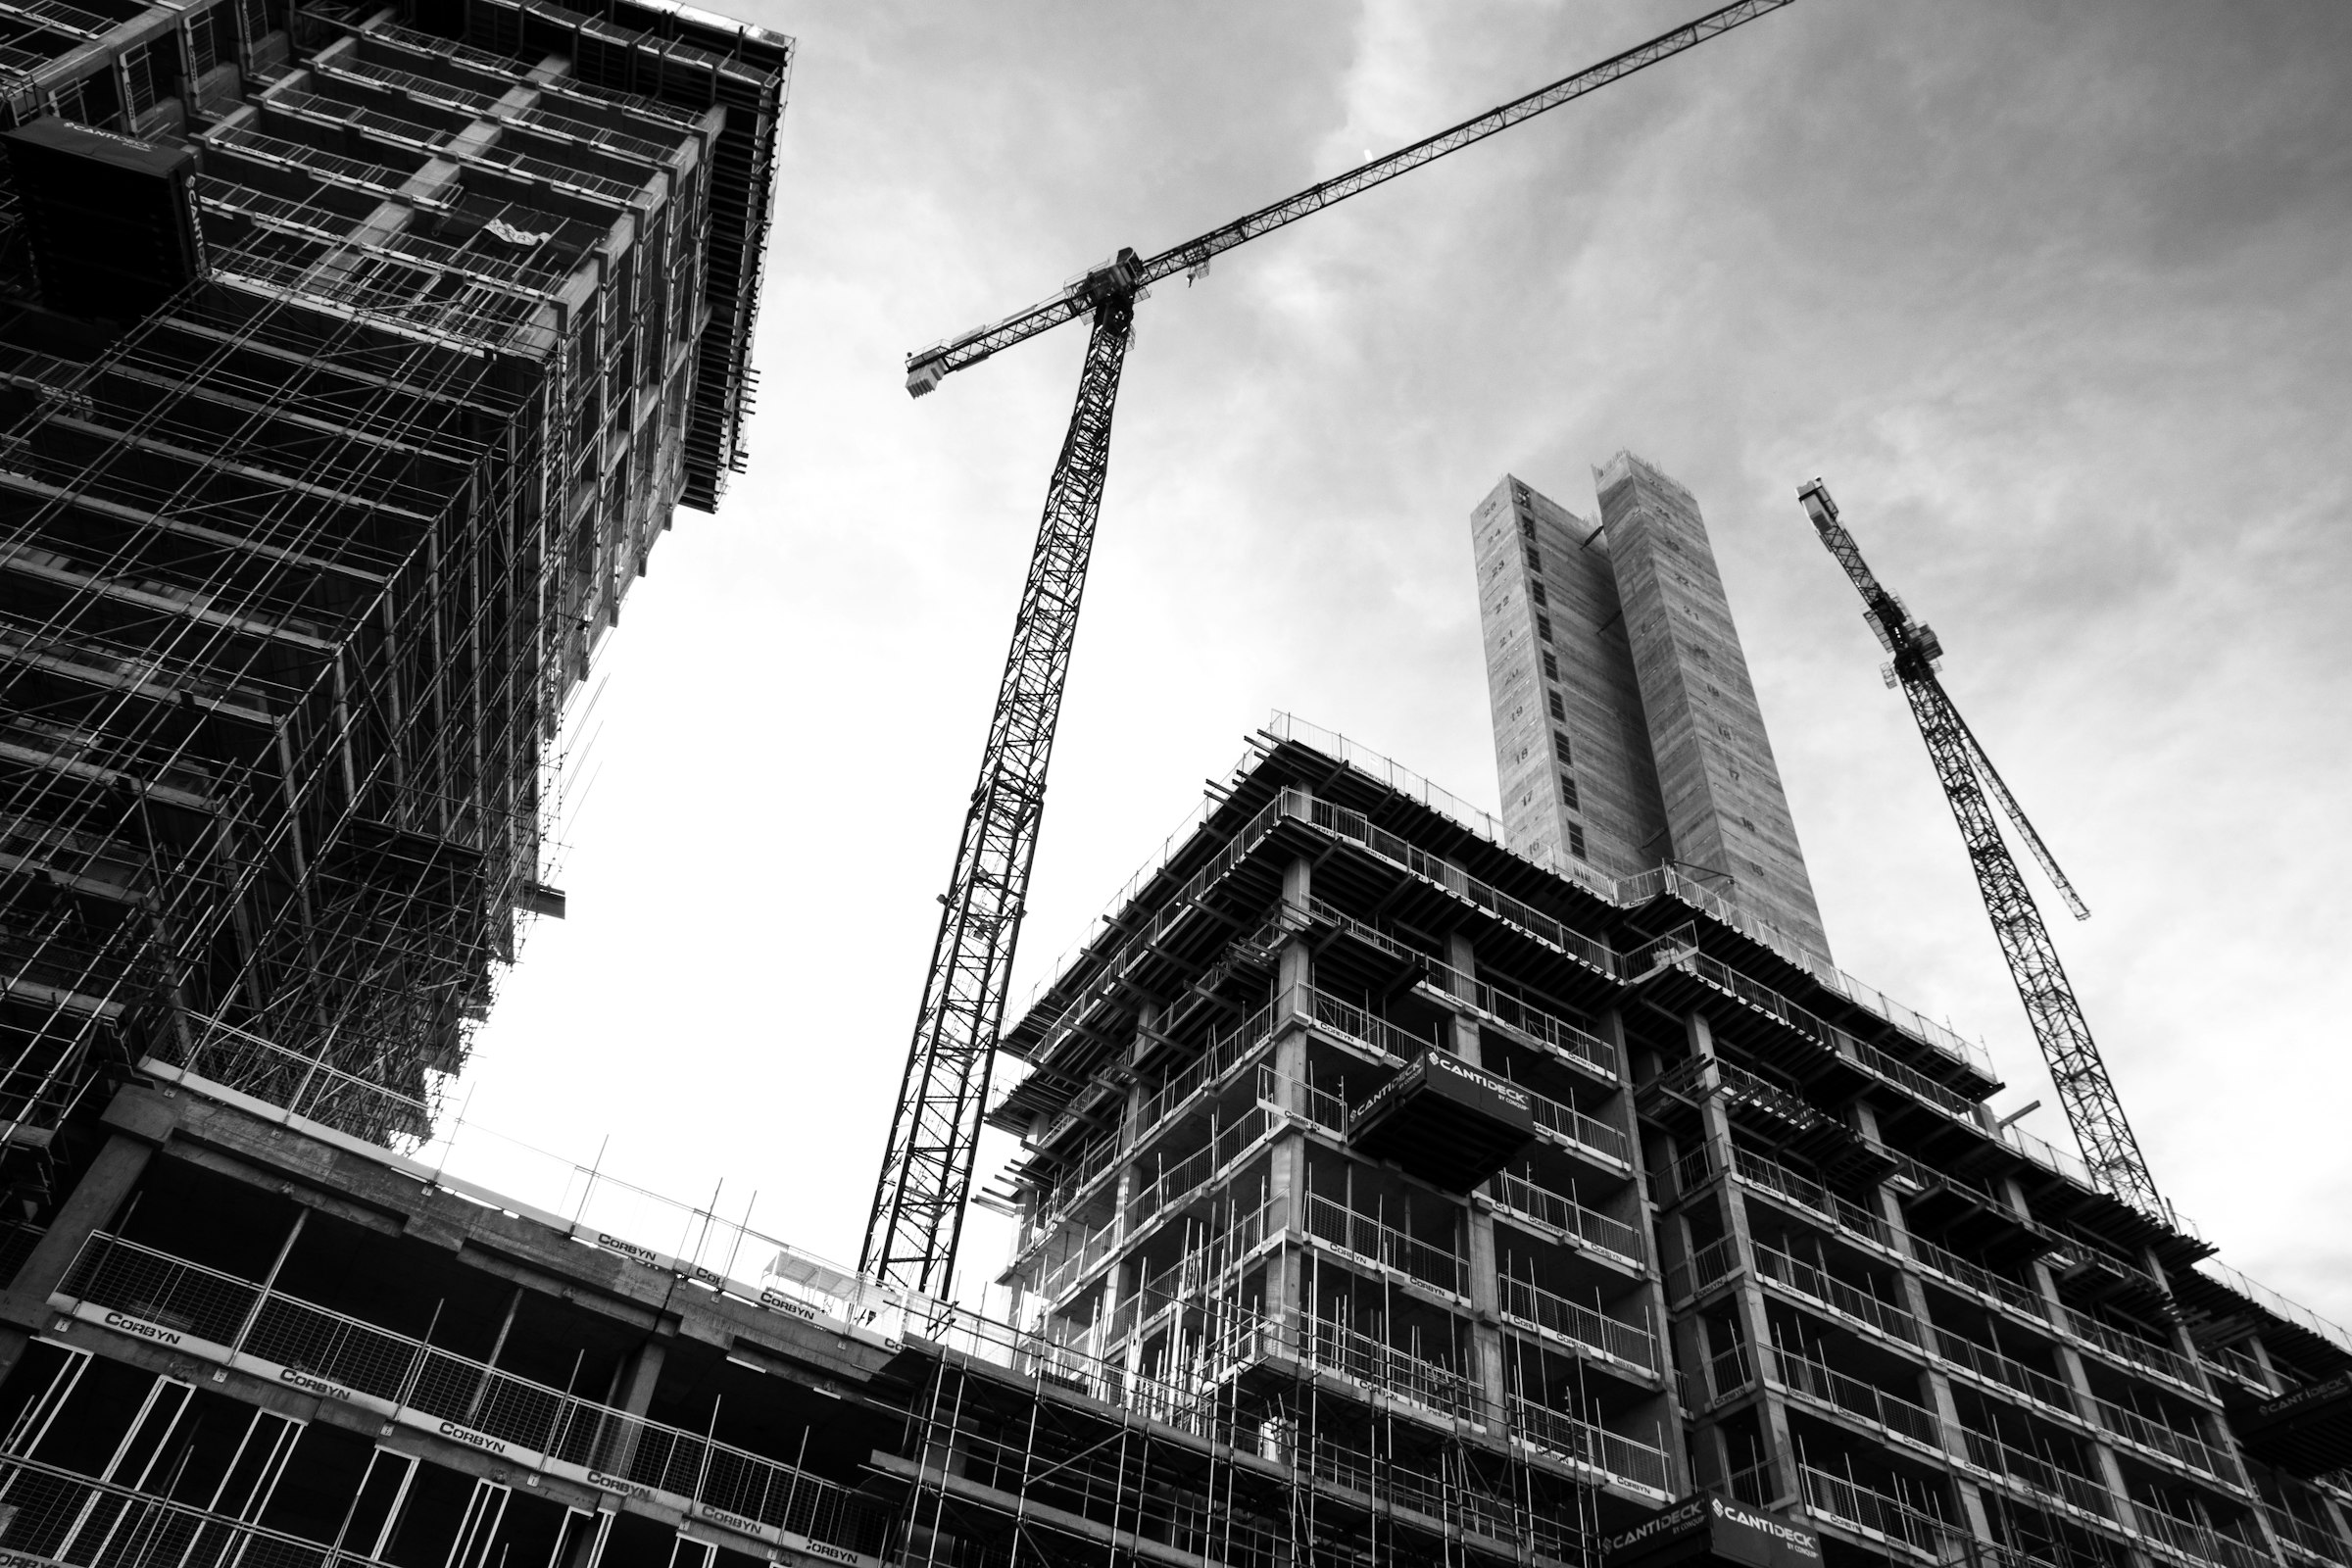
Image credit: Juzzepo on Unsplash. Free to use under the Unsplash License.
Sources
- U.S. Bureau of Economic Analysis, Gross Domestic Product, 3rd Quarter 2026 (Advance Estimate), https://www.bea.gov/sites/default/files/2026-10/gdp3q26-adv.pdf
- Board of Governors of the Federal Reserve System, Federal Reserve issues FOMC statement, October 28, 2026, https://www.federalreserve.gov/newsevents/pressreleases/monetary20261028a.htm



Let's connect
For organizations planning commercial, industrial, or infrastructure work, we will review the project and recommend the appropriate delivery approach.

Join our team
If you hold yourself to careful, accountable work, you already work the way we do.