
news +insights
New Home Sales Slip to 676,000 in September as Supply Holds at 8.4 Months
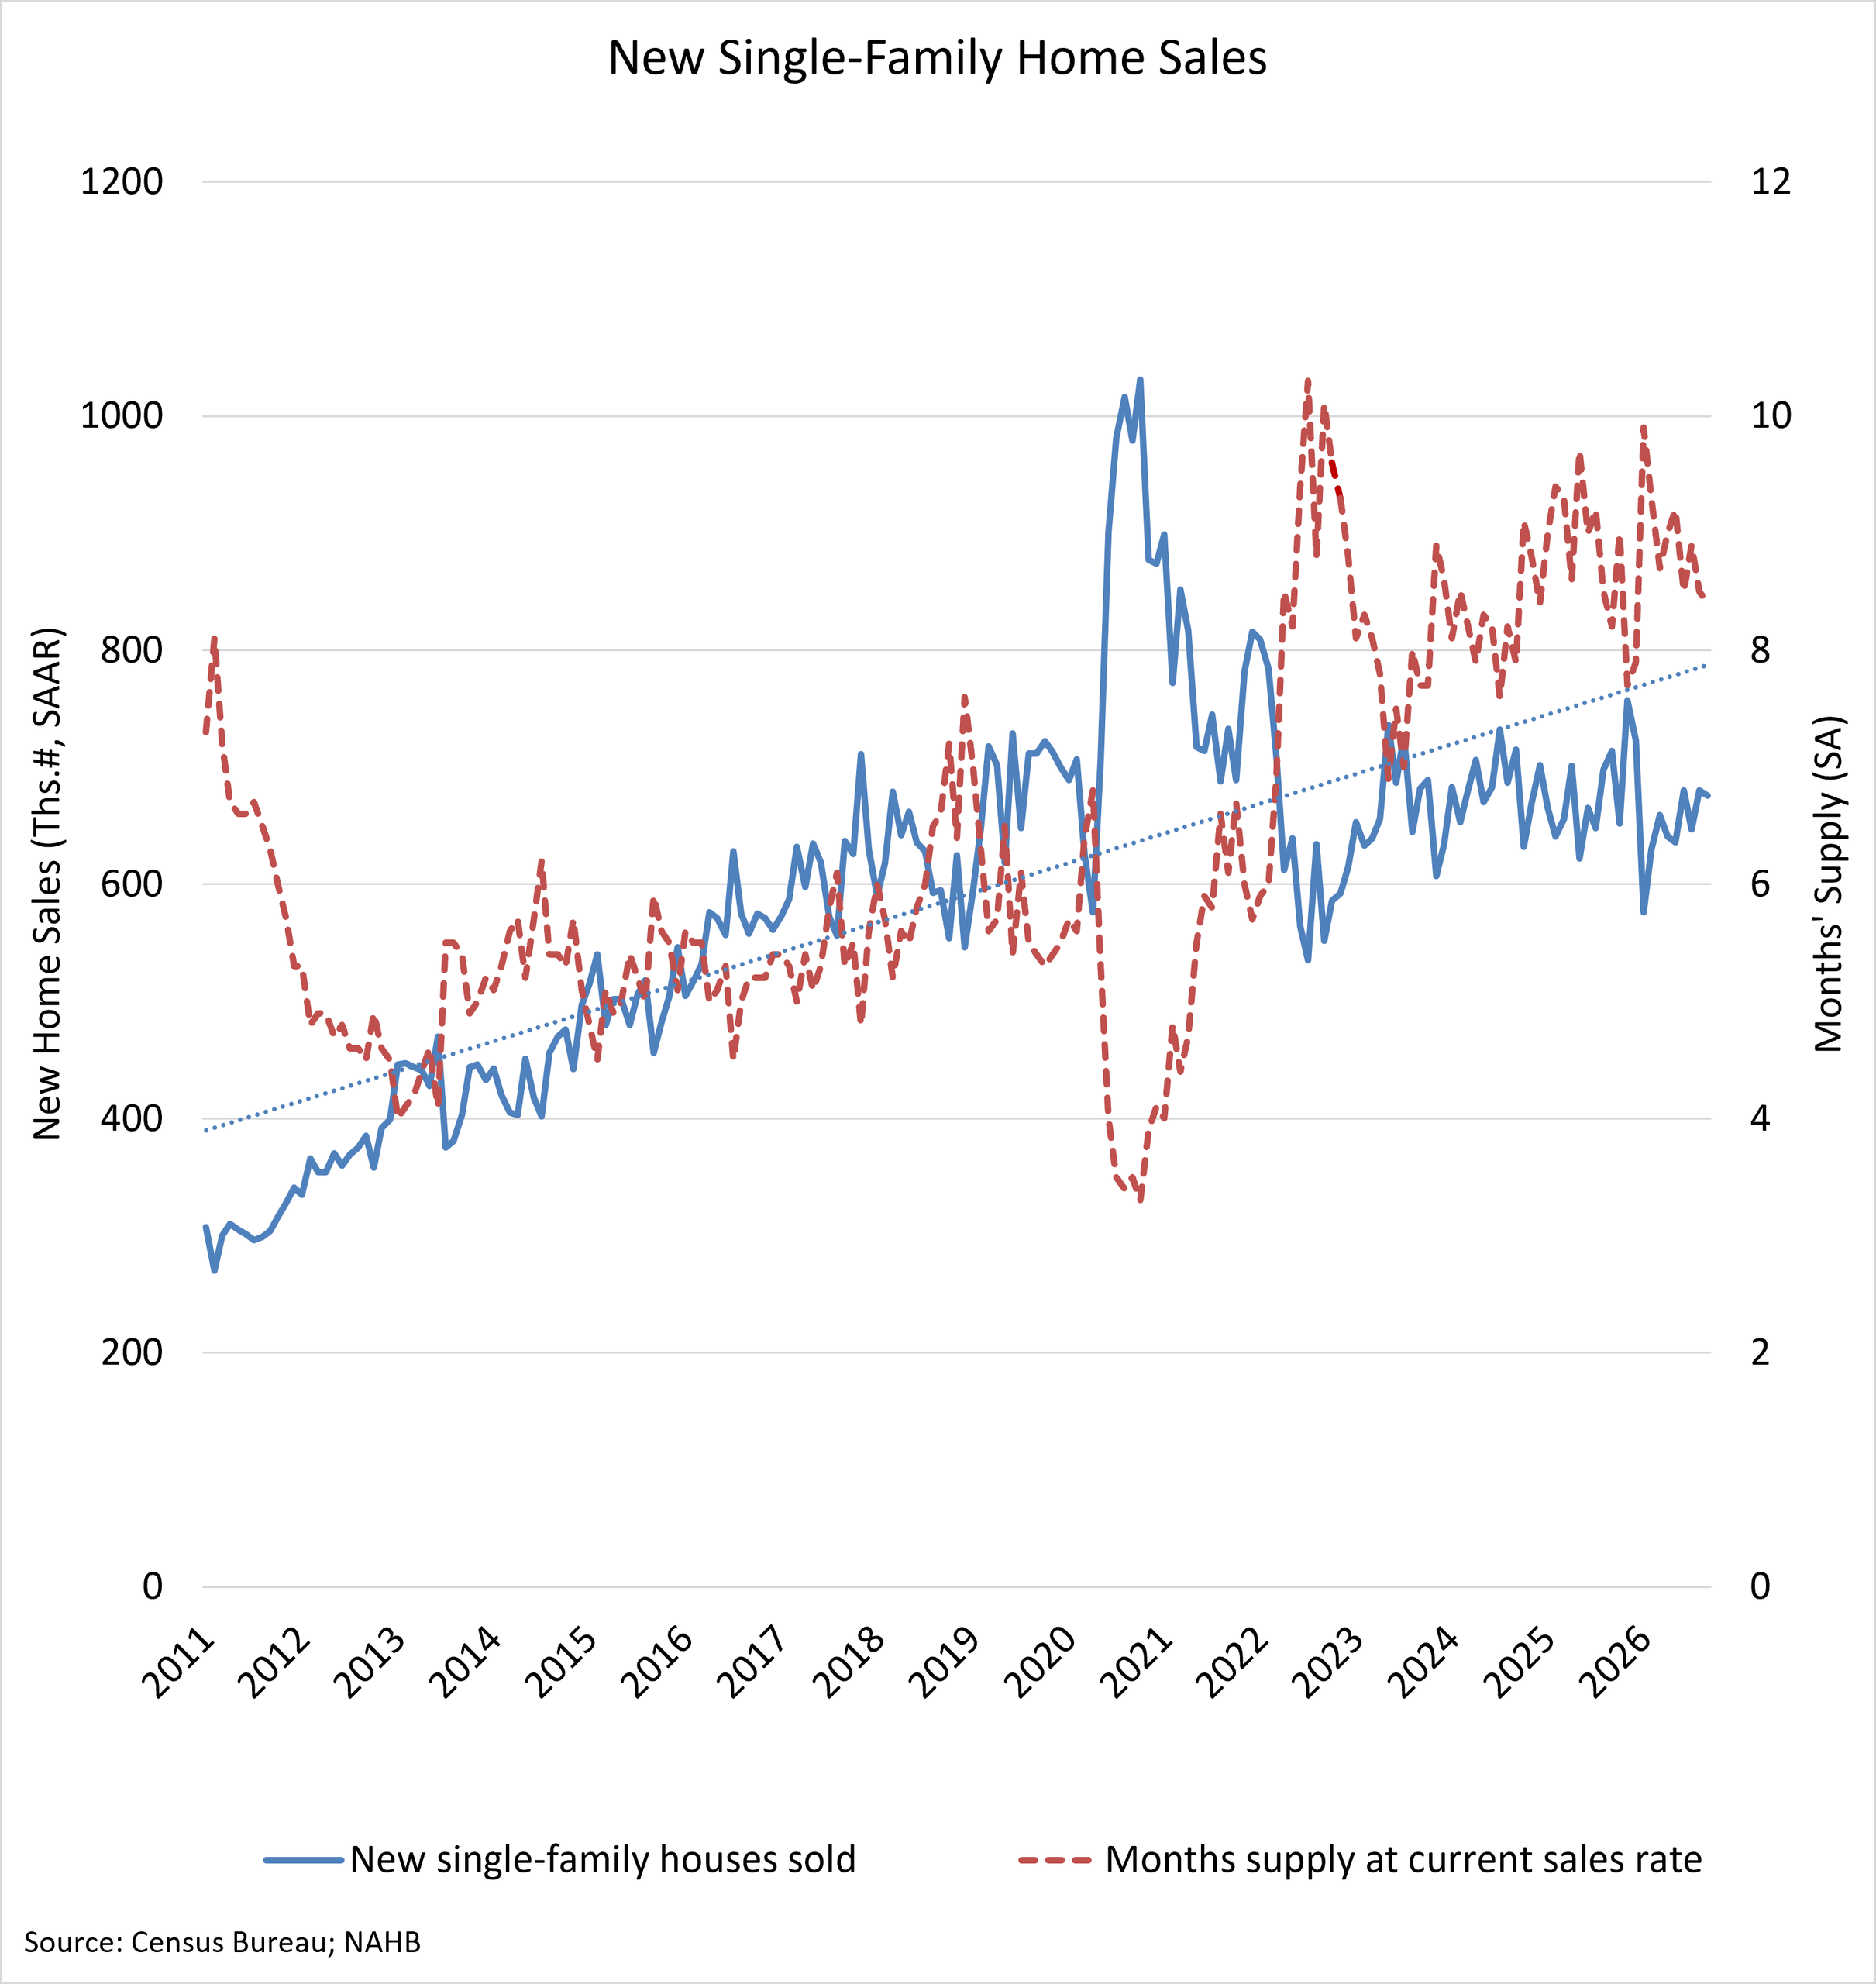
New home sales in September came in at a seasonally adjusted annual rate of 676,000, down 0.6% from a revised August pace of 680,000 and 5.3% below September 2025, according to the joint Census Bureau and HUD report released Tuesday, October 27 (U.S. Census Bureau). The supply of new homes for sale held near 8.4 months, a level the home building industry considers well above balanced.
What Happened
The New Residential Sales report for September 2026 showed sales of new single-family houses at a 676,000 annual pace. The Census Bureau noted that both the monthly decline and the 5.3% yearly decline fall within the survey margin of error, at plus or minus 13.8% and 12.5% respectively, so neither change is statistically significant (U.S. Census Bureau). August was revised down to 680,000 from the 684,000 first reported (RISMedia).
The National Association of Home Builders said sales were 2.9% lower year to date and pointed to high mortgage rates and economic uncertainty as the main reasons buyers are waiting (NAHB Eye on Housing). NAHB also reminded readers that the government counts a sale when a contract is signed or a deposit is taken, no matter what stage of construction the house is in (NAHB Eye on Housing).
The Numbers Behind New Home Sales in September
- Sales pace: 676,000 annual rate, compared with 680,000 in August and 714,000 in September 2025 (U.S. Census Bureau).
- Homes for sale: 476,000 at the end of September, down 1.0% from August and 2.3% from a year earlier (U.S. Census Bureau).
- Months of supply: 8.4, compared with 8.5 in August and 8.2 a year earlier (U.S. Census Bureau).
- Median price: $400,400, up 3.9% from August but down 3.9% from $416,800 a year earlier (U.S. Census Bureau).
- Average price: $472,800, down 6.7% from $506,800 a year earlier (U.S. Census Bureau).
Where the Inventory Sits
NAHB broke the 476,000 homes for sale into stages of construction. Completed homes ready to occupy totaled 111,000, about one quarter of inventory, while homes under construction made up 53% (NAHB Eye on Housing). The remainder had not yet started construction. NAHB said a five to six month supply generally indicates a balanced market, and it put combined new and existing home supply at 5.2 months (NAHB Eye on Housing).
Price mix is shifting toward lower price points. Homes priced from $300,000 to $499,999 made up 50% of September sales, homes under $300,000 made up 20%, and homes above $500,000 made up 31% (NAHB Eye on Housing). NAHB said the share under $300,000 has grown since the start of the year while the share above $500,000 has shrunk (NAHB Eye on Housing).
Regional Results
Regional numbers moved in different directions. Compared with August, sales rose 28.0% in the Northeast and 21.4% in the West, while they fell 6.6% in the South and 7.3% in the Midwest (NAHB Eye on Housing). Against September 2025, the Northeast was the only region with a gain, up 10.3%, while the West fell 17.4% (NAHB Eye on Housing). RISMedia reported the South, the largest region for new construction, at a 413,000 annual rate (RISMedia).
Joel Berner, senior economist at Realtor.com, told RISMedia that Northeast data “is quite noisy, so the improvement there should be considered with some caution,” and said the regional splits point to a slowdown that is geographically widespread (RISMedia). For upstate New York builders, that caution matters: a single month of Northeast gains is not a trend.
What Builders and Analysts Are Saying
Danushka Nanayakkara-Skillington, NAHB assistant vice president for forecasting and analysis, said the decline is consistent with softer builder sentiment and shows how sensitive demand remains to financing costs (RISMedia). NAHB Chairman Bill Owens said builders continue to offer incentives and adjust pricing to attract buyers (RISMedia). Sarah Bonnarens of NewHomeSource and Zonda said mortgage rates above 7% have added another hurdle and that three in five builders reported slow demand as a concern in September (RISMedia).
The report follows other soft housing data this month. Census reported earlier that September housing starts fell 5.2%, and NAHB builder confidence fell to 29 in October, its lowest reading since 2012 (RISMedia).
Implications for Owners, Developers, Contractors and Subs
- Residential subs: With 111,000 finished homes unsold and builders slowing deliveries, as Berner noted, framing, drywall and finish trades tied to production builders should expect fewer new starts until inventory clears (RISMedia).
- Developers: The move toward homes under $500,000 suggests product and lot planning that targets lower price points is where sales are holding up (NAHB Eye on Housing).
- Lenders and owners: NAHB tied any improvement to lower mortgage rates and better affordability, so rate moves remain the key variable to watch (RISMedia).
What to Watch
The Census Bureau will publish October new home sales next month. Watch whether completed inventory falls from 111,000, whether the median price holds near $400,000, and whether the South, which carries most of national volume, stabilizes. Housing starts and permits for October will show whether builders are pulling back further.
Bottom Line
New home sales were flat in September at a 676,000 pace, down from a year ago, with 8.4 months of supply and a growing share of sales at lower prices. The data points to a market where builders are cutting prices and slowing new starts rather than adding inventory (U.S. Census Bureau).
Key Questions
How many new homes were sold in September 2026?
New single-family home sales ran at a seasonally adjusted annual rate of 676,000 in September 2026, down 0.6% from August and 5.3% from September 2025 (U.S. Census Bureau).
What was the median new home price in September 2026?
The median sales price of a new home in September 2026 was $400,400, up 3.9% from August and down 3.9% from $416,800 a year earlier (U.S. Census Bureau).
How many months of new home supply are there?
There was an 8.4 month supply of new homes at the September 2026 sales pace, with 476,000 homes for sale at the end of the month (U.S. Census Bureau).
How many completed new homes are unsold?
NAHB reported 111,000 completed, ready to occupy new homes for sale in September 2026, about one quarter of total new home inventory (NAHB Eye on Housing).
Related Coverage
- September Housing Starts Fall 5.2% to 1.221 Million Annual Rate
- Builder Confidence Falls to 29 in October, Lowest Since 2012
- September Construction Starts Dip 1.5% as Commercial Falls 18%
Image credit: National Association of Home Builders, Eye on Housing. Image from the source article.
Sources
- U.S. Census Bureau and HUD, Monthly New Residential Sales, September 2026, https://www.census.gov/construction/nrs/current/index.html
- NAHB Eye on Housing, Affordability Challenges Push New Home Sales Lower, https://eyeonhousing.org/2026/10/affordability-challenges-push-new-home-sales-lower/
- RISMedia, Buyer and Builder Activity Remain Muted as New-Home Sales Slip Slightly, https://www.rismedia.com/2026/10/27/buyer-and-builder-activity-remain-muted-as-new-home-sales-slip-slightly/




Let's connect
For organizations planning commercial, industrial, or infrastructure work, we will review the project and recommend the appropriate delivery approach.

Join our team
If you hold yourself to careful, accountable work, you already work the way we do.